Analytics
Cohort
Cohort retention, churn timing, lifetime metrics, and retention heatmap.
Cohort analysis groups subscribers by when they started and tracks how long they stay, how much they spend, and when they churn.
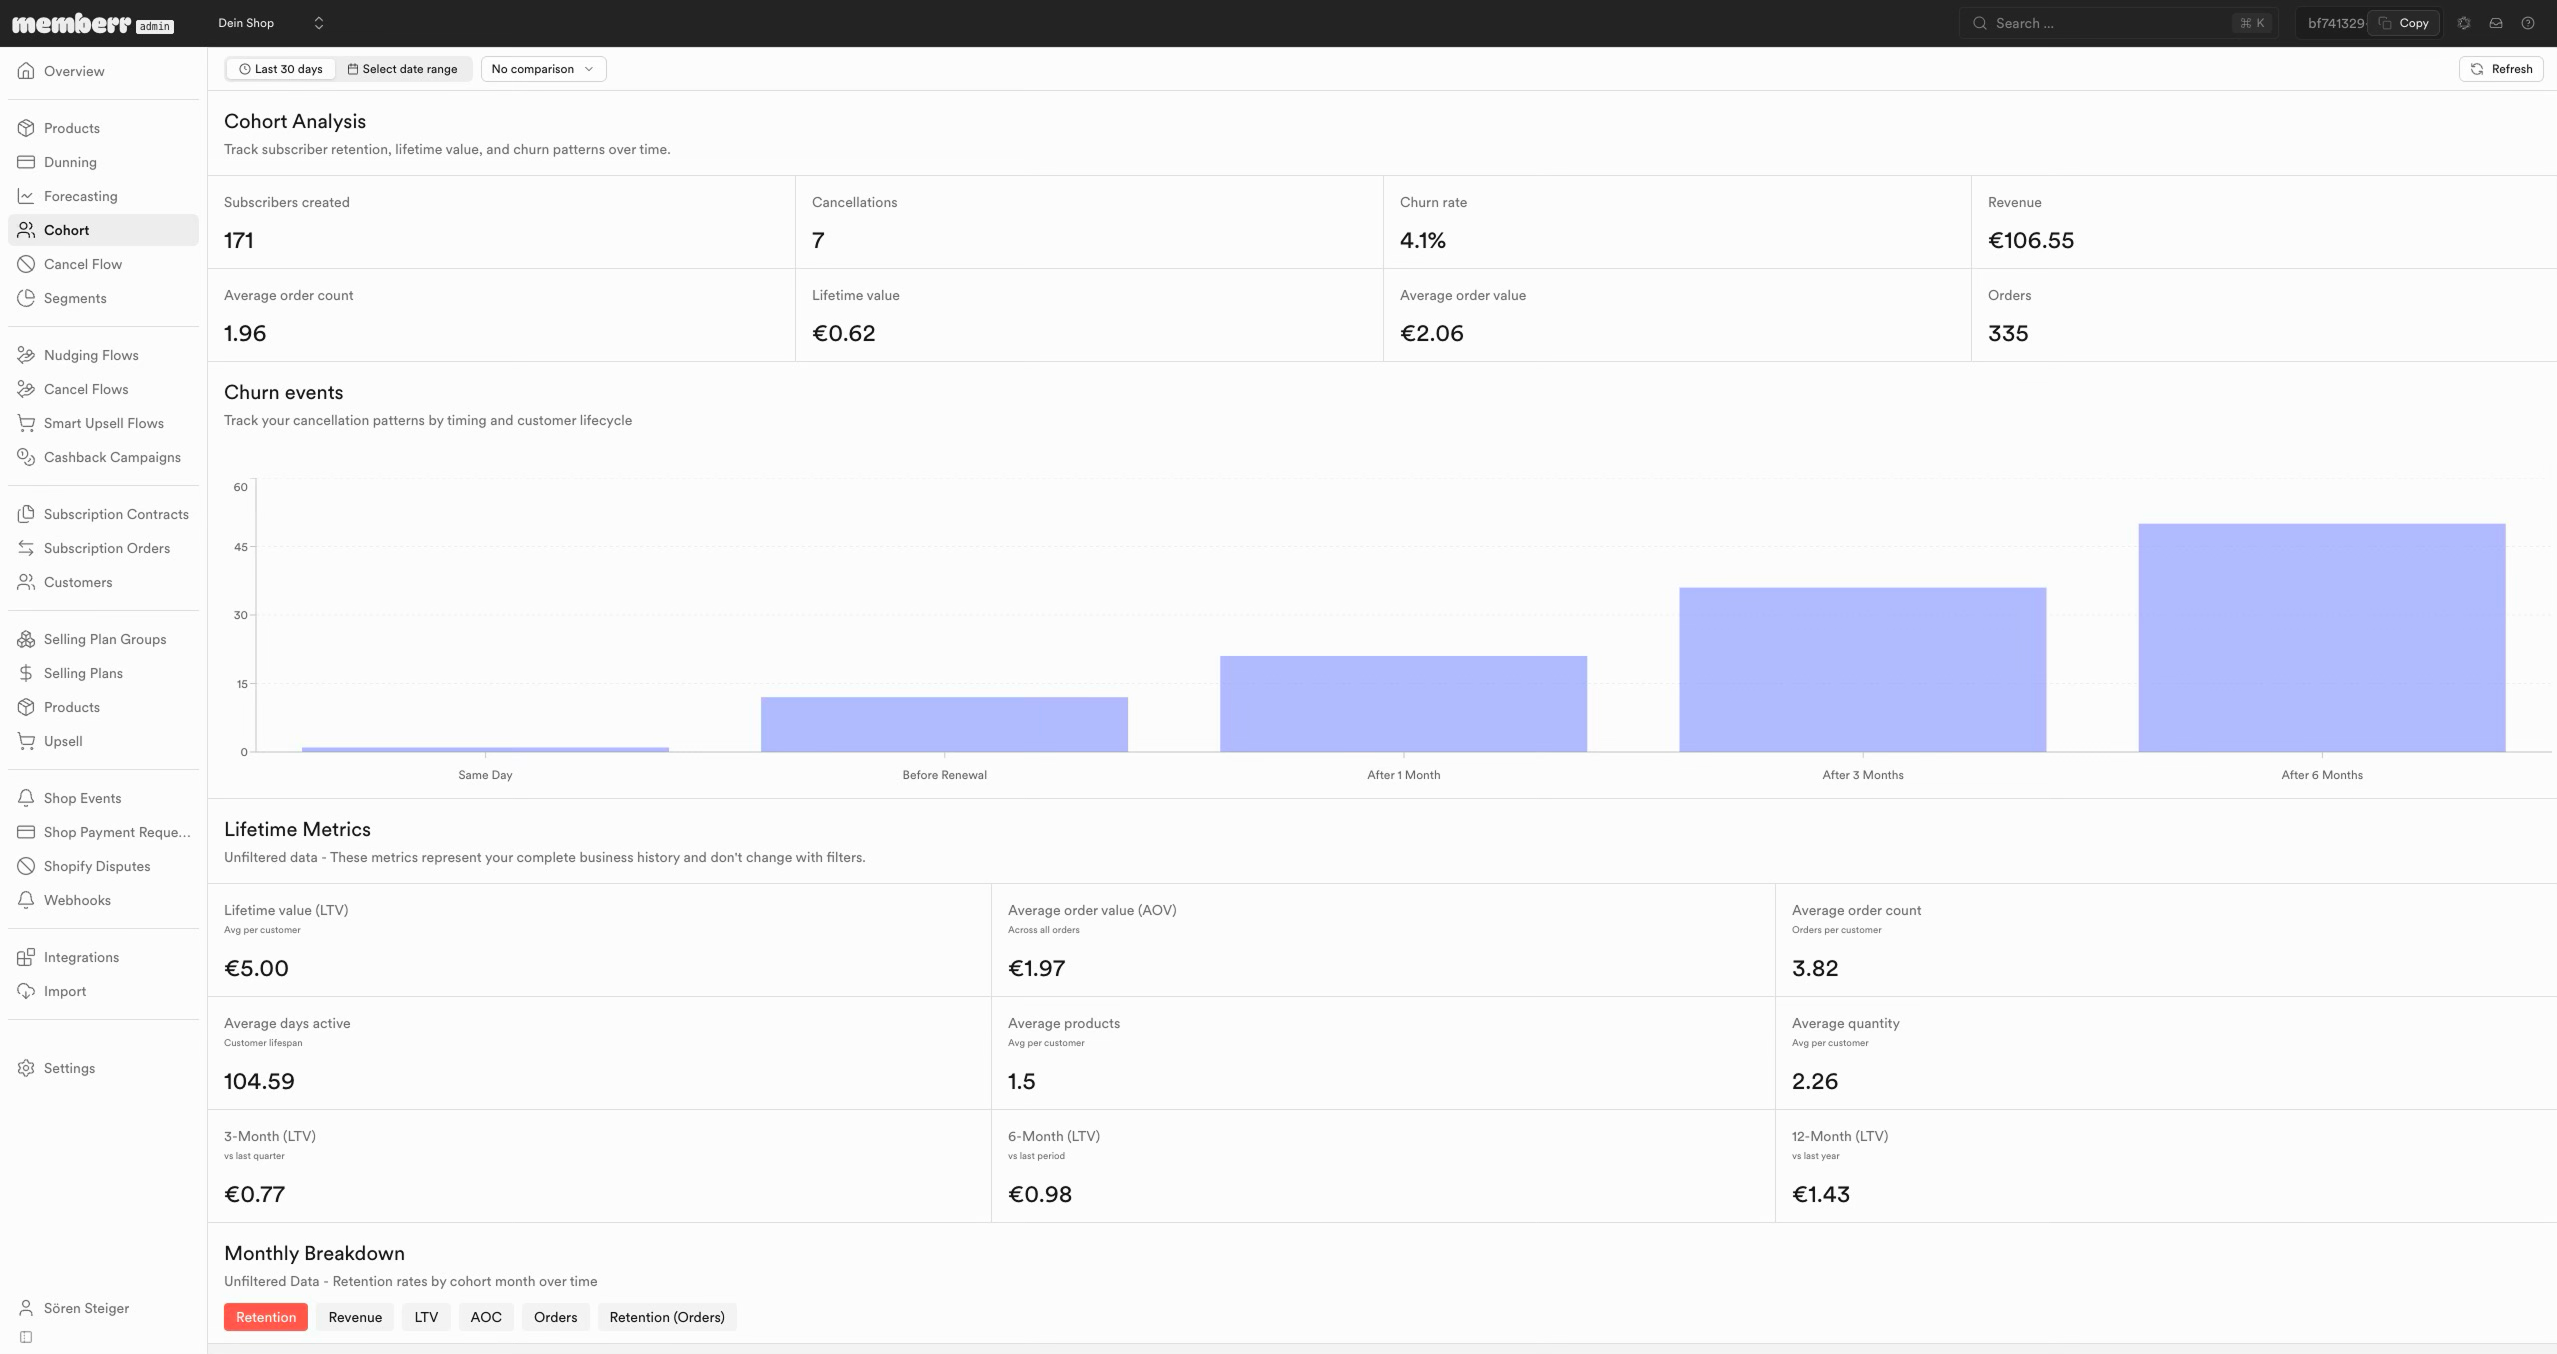
Summary KPIs
| Metric | What it means |
|---|---|
| Subscribers created | New subscribers in the selected period. |
| Cancellations | Cancellations attributed to those cohorts in the period. |
| Churn rate | Cancellations relative to subscribers created. |
| Revenue / Orders | Period revenue and order count for the cohort cut. |
| Average order count / AOV / Lifetime value | Engagement and value for the filtered window. |
Churn events and lifetime metrics
The Churn events chart buckets cancellations by lifecycle timing (for example same day, before renewal, after 1 / 3 / 6 months). Lifetime metrics (often labeled as unfiltered / all-time) show LTV, AOV, average days active, and trailing LTV windows (3 / 6 / 12 month).
Retention heatmap
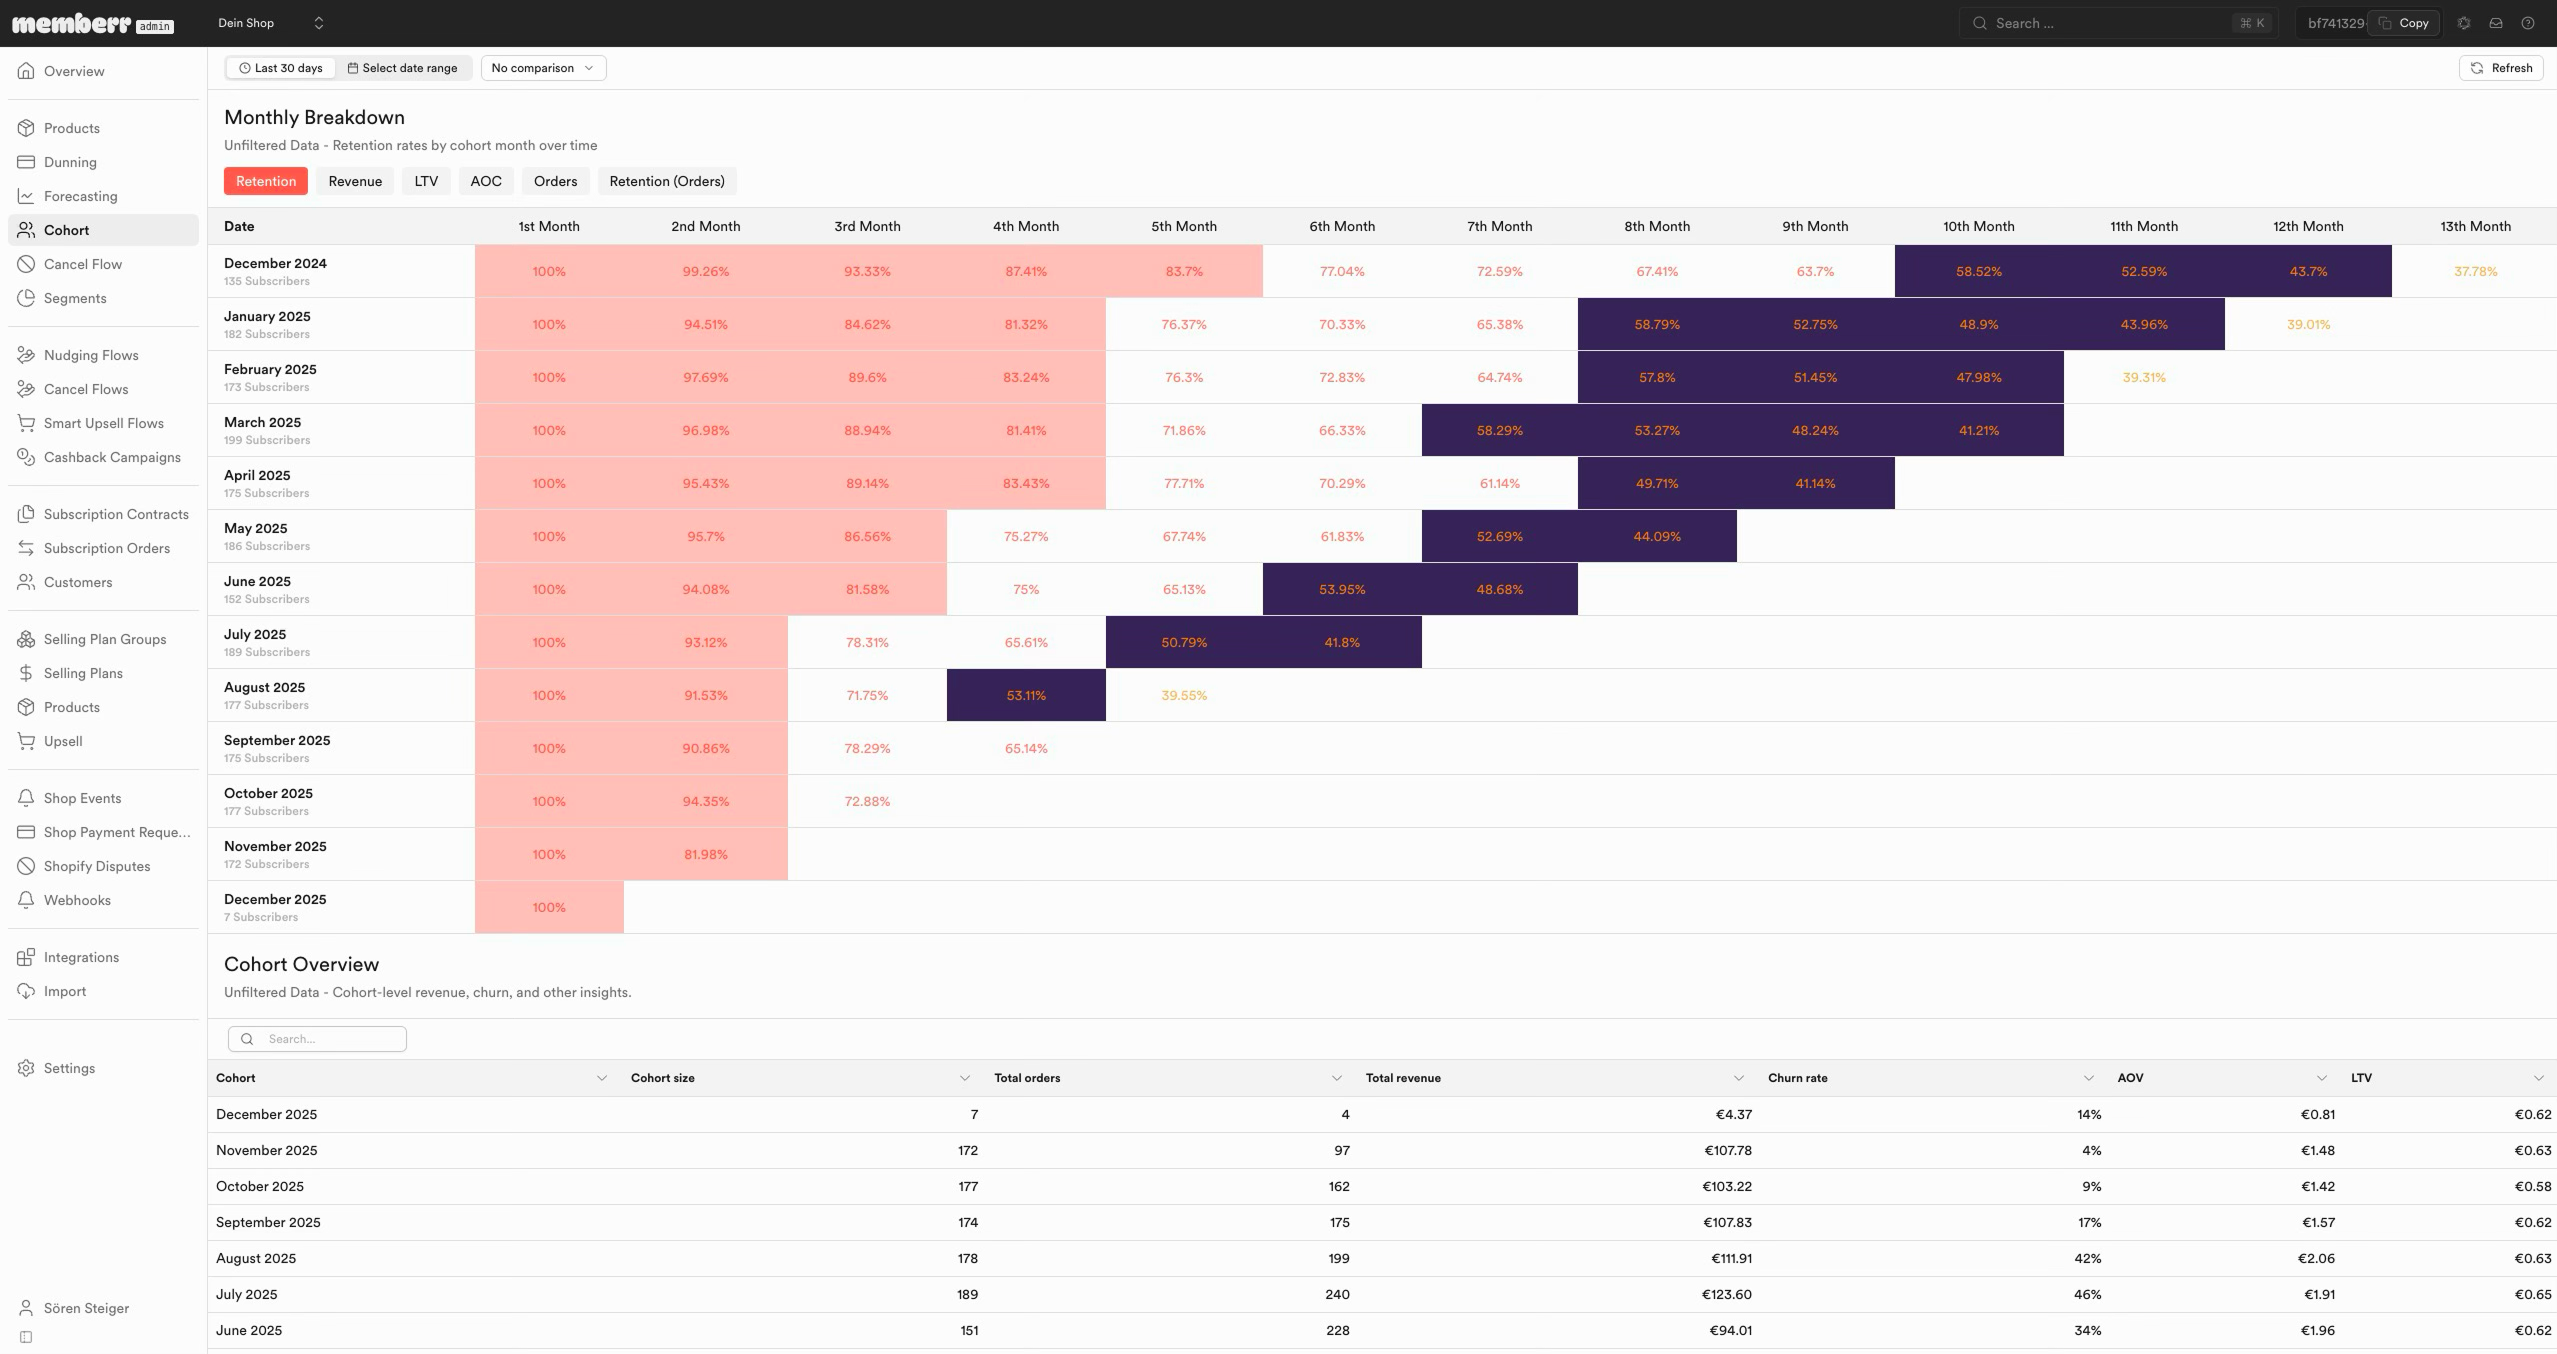
The monthly breakdown / heatmap toggles views such as Retention, Revenue, LTV, AOV, Orders, and Retention (Orders). Darker cells usually mean stronger retention for that cohort month at that age. Use the overview table under the heatmap for exact percentages per cohort row.