Products
Product performance across subscriptions, one-time add-ons, and shipping intervals.
Products shows which catalog items drive subscription revenue, how often add-ons attach, and which shipping intervals customers choose.
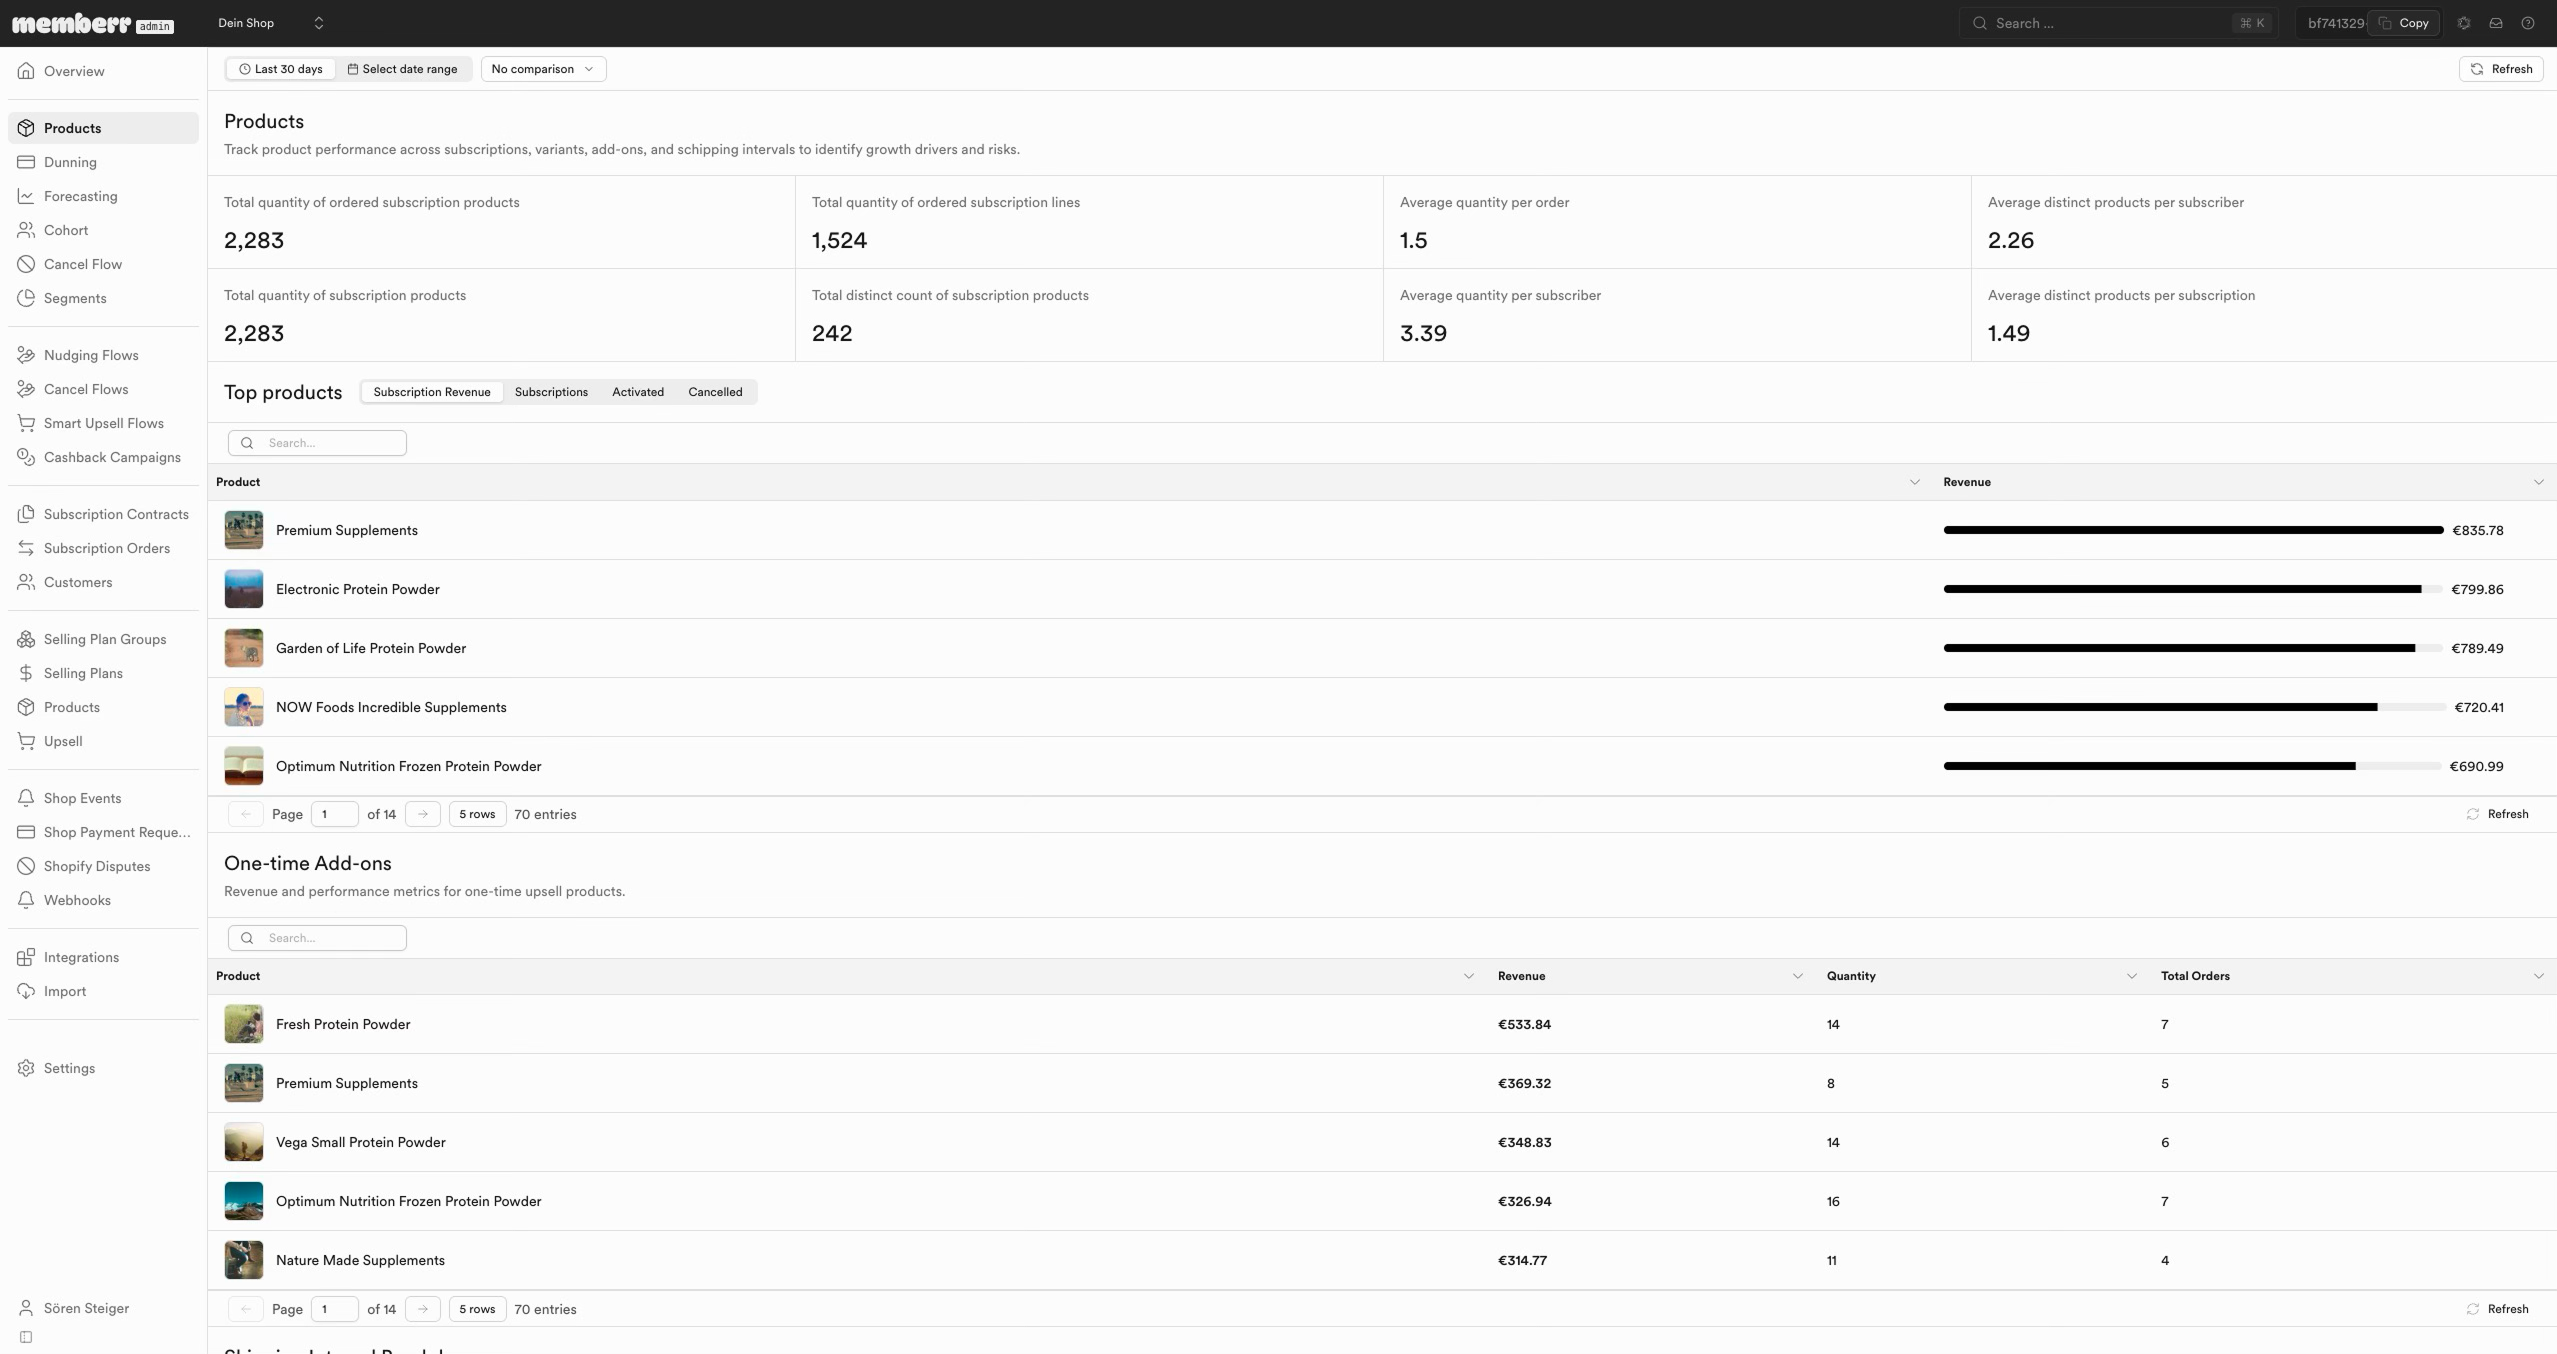
Product KPIs
Typical summary metrics include:
| Metric | What it means |
|---|---|
| Ordered subscription products / lines | Units and line counts billed on subscription orders. |
| Average quantity per order | How many units land on a typical subscription order. |
| Distinct products per subscriber / subscription | Catalog breadth in the average contract. |
| Total distinct subscription products | How many unique products appear in the period. |
Top products and add-ons
The Top products table ranks items by modes such as Subscription Revenue, Subscriptions, Activated, or Cancelled. Search and pagination help when the catalog is large.
One-time add-ons lists upsell products sold once on a delivery (revenue, quantity, orders) - the same class of items customers can add from the portal or that staff add on a contract.
Shipping intervals
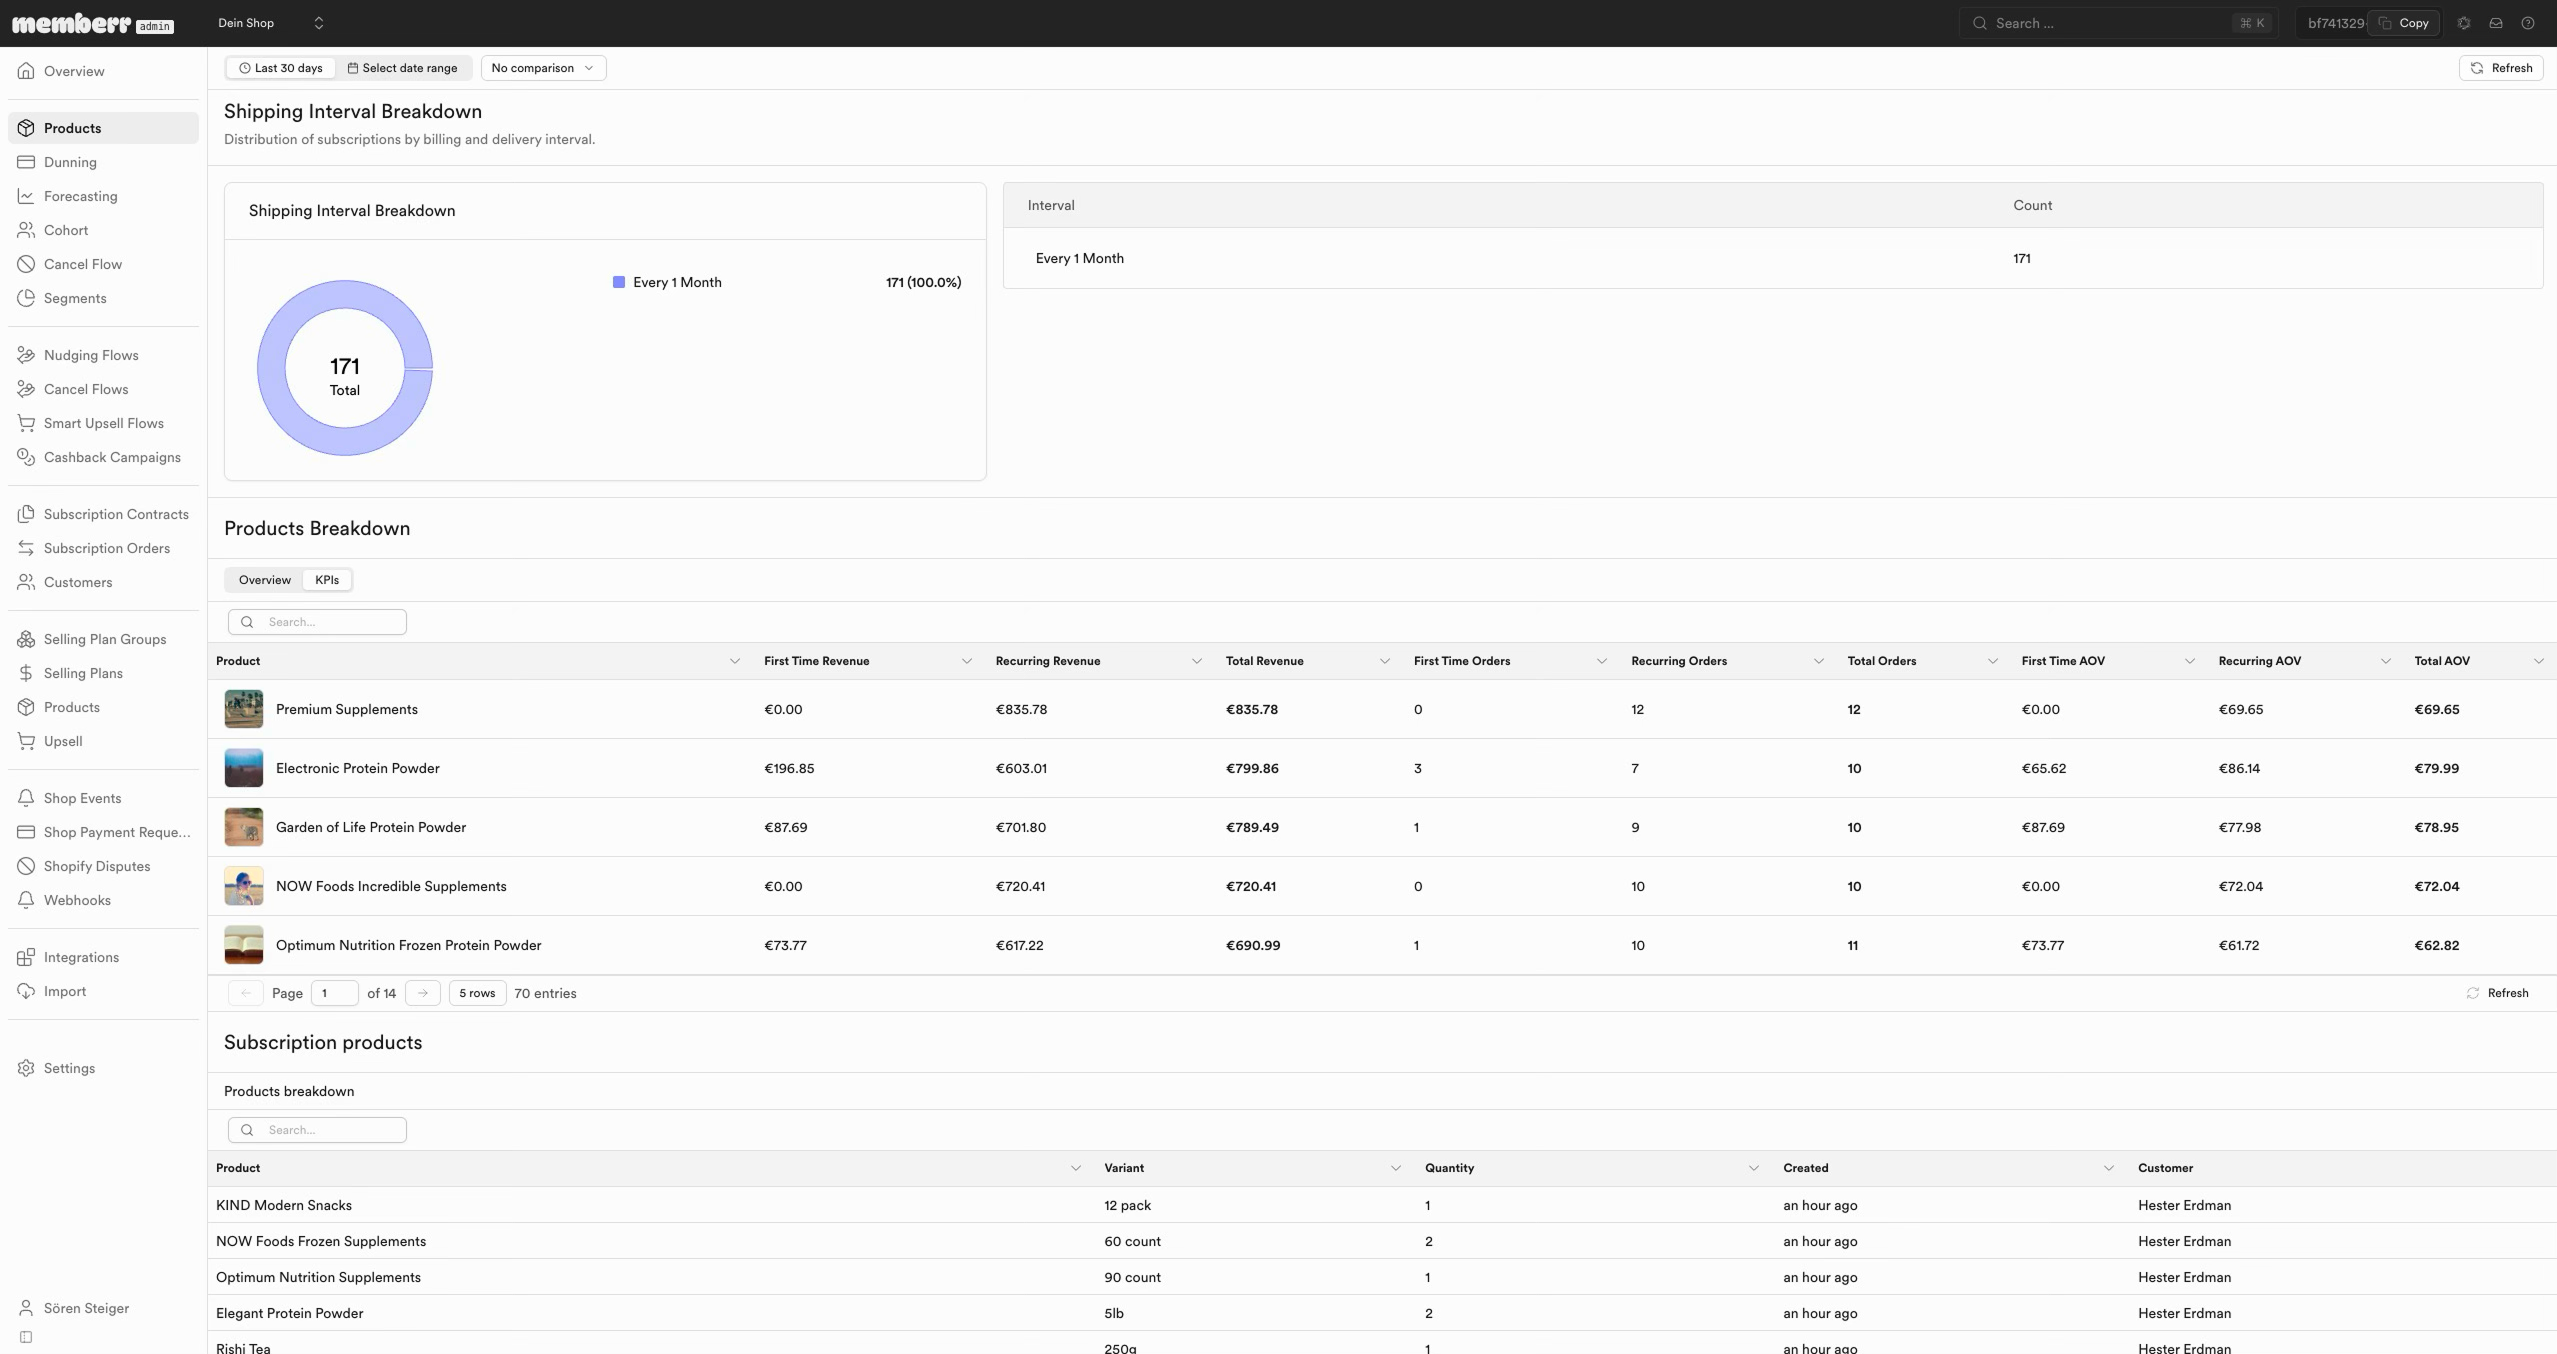
Interval charts show how subscribers distribute across delivery cadences (for example every 2 weeks vs monthly). Skew toward longer intervals often correlates with lower churn; very short intervals can mean higher ops load.
Product breakdown
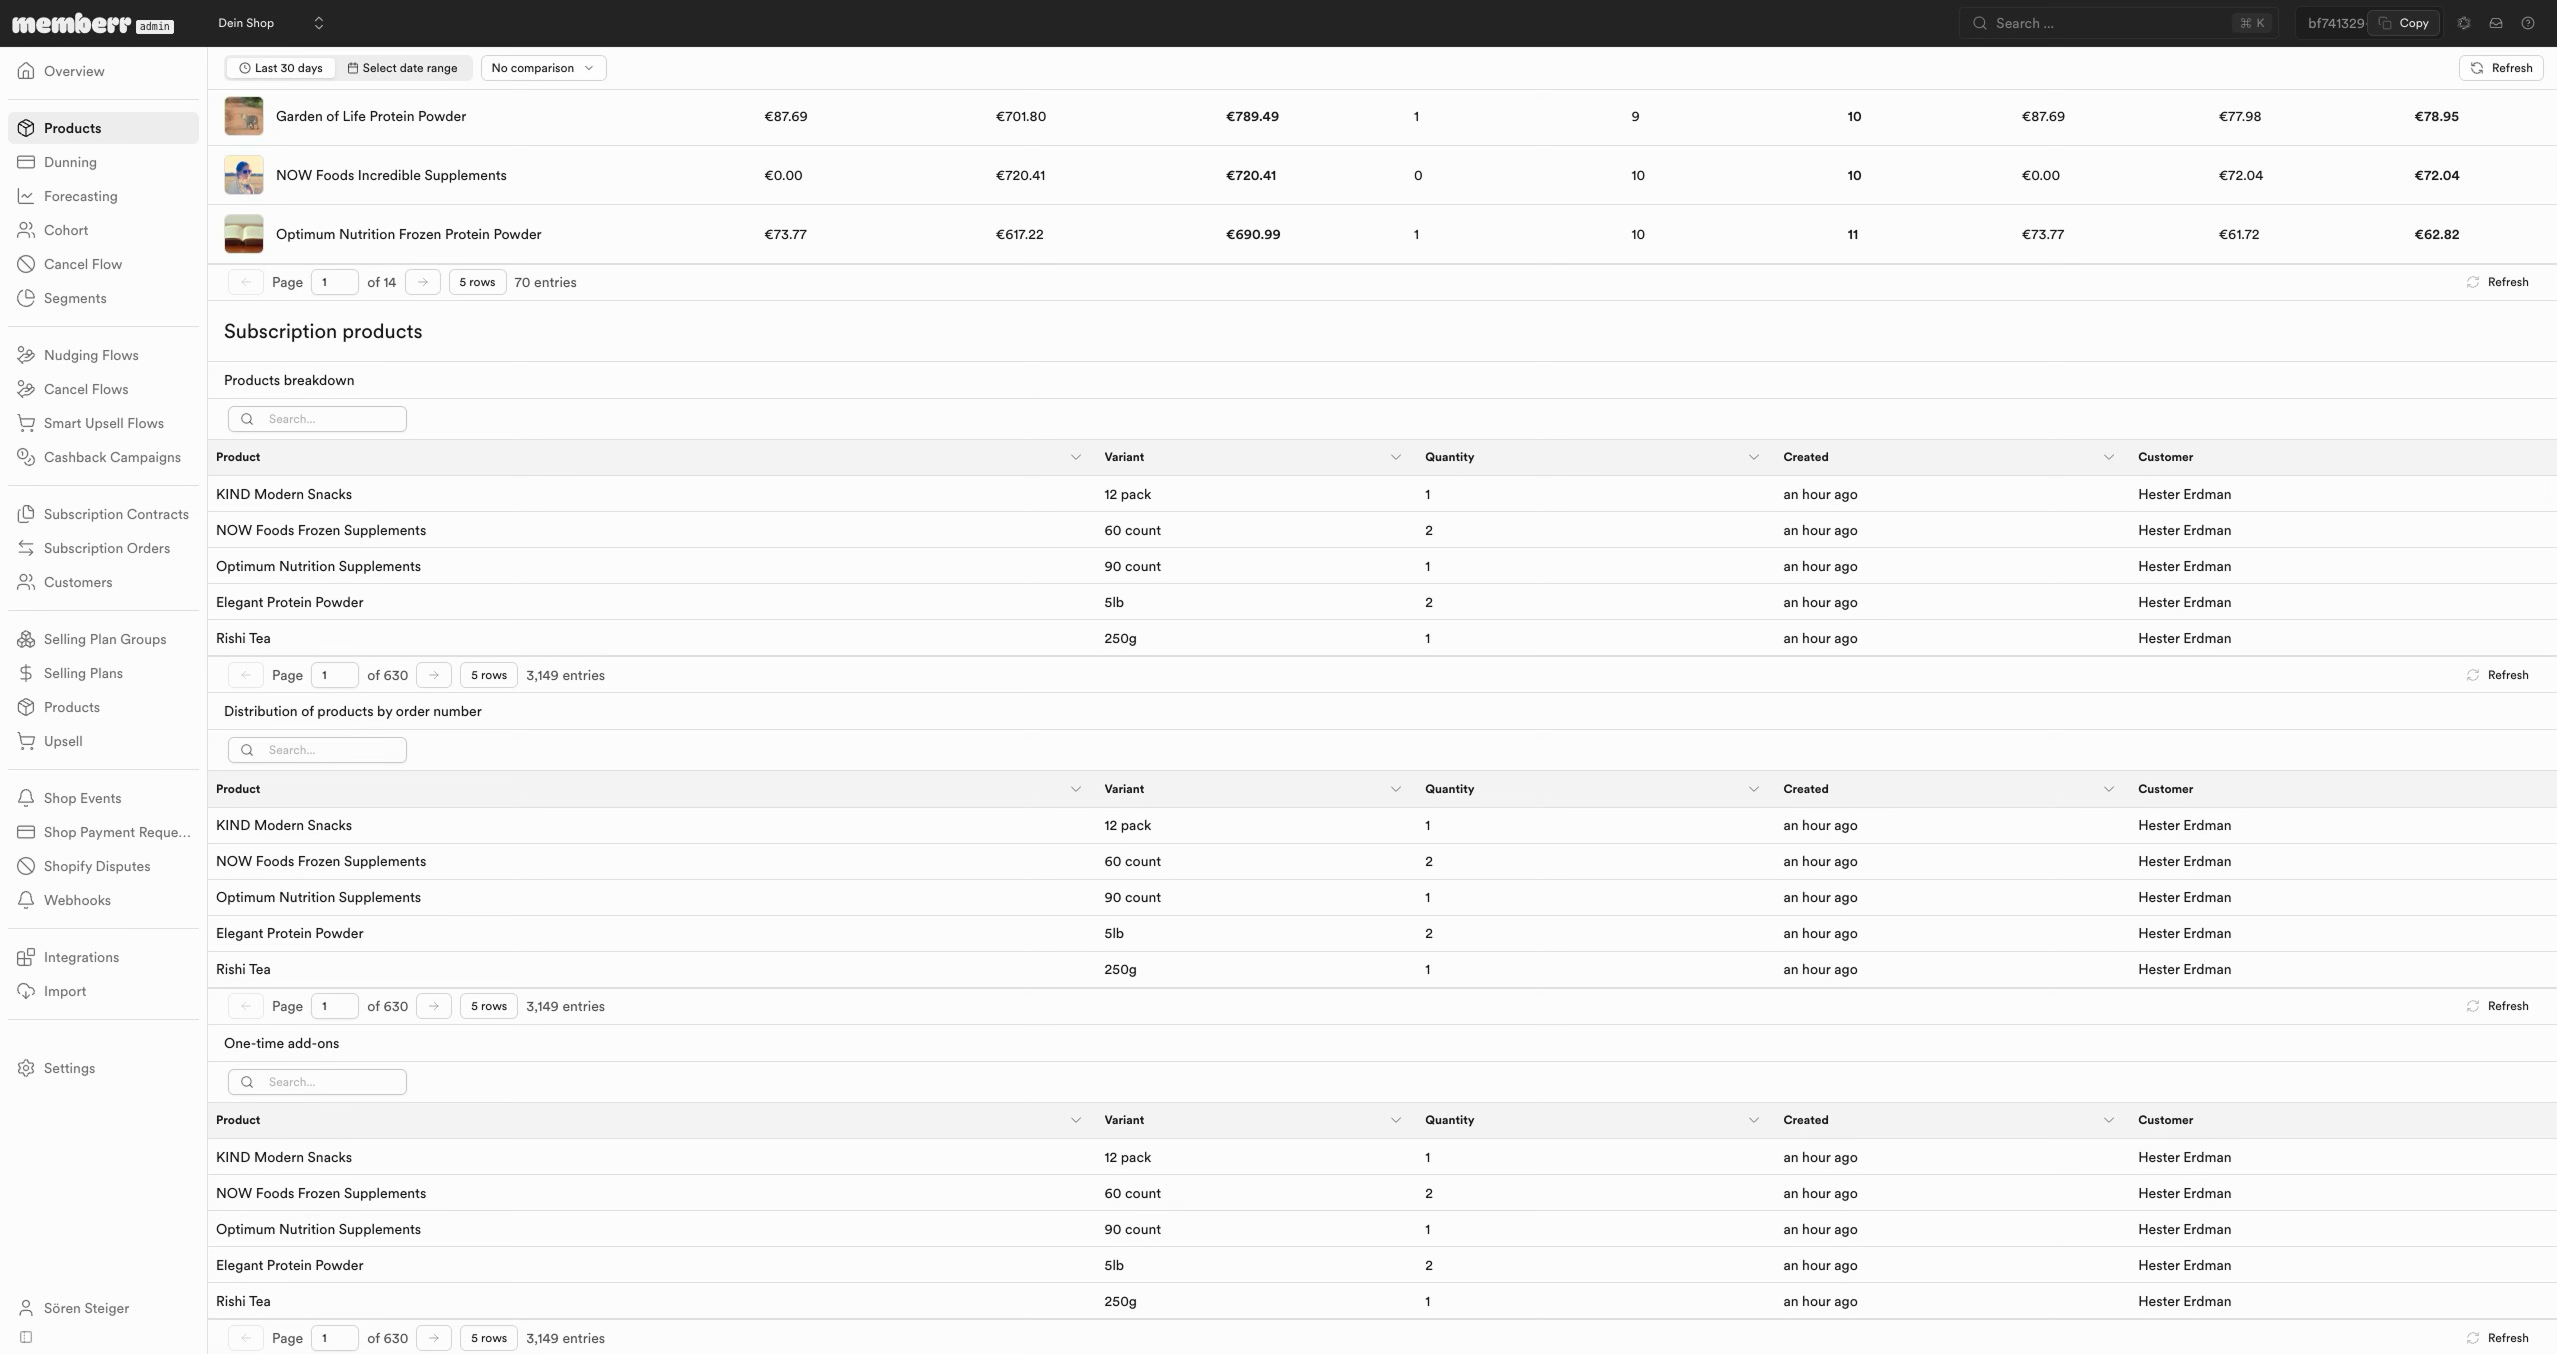
The breakdown table is the detailed cut of product-level KPIs for export-minded review and support triage.